Activity
Make a Winter Weather Pictograph
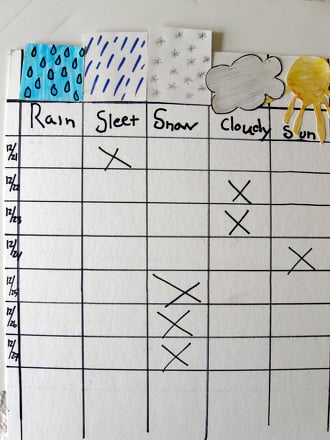
Watching the winter snow pile up on a grassy yard is nice, but investigating it is even better! Boost your child's science and observation skills by guiding her through this winter weather-filled project. She'll chart the amount of snow or hours of rain that have fallen at your house this winter using a ruler, measuring tape, or even her hands! This ongoing seasonal graphing activity will even enlist her math skills and organization ability.
Grade:
Subjects:
Math
Science
Data and Graphing
Earth and Space Science
Picture Graphs
Bar Graphs
Weather and Seasons
Thank you for your input.
What You Need:
- Poster board
- Markers
- Ruler or other measuring device
What You Do:
- Discuss the season of winter with your child. Ask her to tell you what types of weather might be seen and felt during this season.
- Use a dark marker and a straight edge, such as a ruler, to help your child create a grid graph on the poster board. Make sure that each cell is large enough for a picture or a number to fit in.
- Have her choose what she would like the rows and columns to represent. For example, each row may be labeled with the month and date number, while each column might be for possible winter weather types. Remind her that it does not just snow in the winter. She will want to include pictures of snow, rain, sleet, ice, clouds, and sun.
- Ask her to draw pictures of the winter weather types at the tops of the columns.
- Observe the weather. If it is sunny or cloudy have your child note that by finding the weather type column and the date row. If it's snowing, try measuring the accumulation with a ruler or other device. Make sure that you use the same device all winter. Ask her to write down the correct measured snowfall total in the corresponding graph cell.
- Repeat every day until winter ends (or until the chart runs out of space)!
Try making other types of graphs with your child. Bar graphs or pie charts are other fun ways to explore basic math concepts.
Related learning resources
Weather Graph
Worksheet
Weather Graph
Observe and record the weather with your kindergartener with this cute fill-in weather graph.
1st Grade
Math
Worksheet
Weather Log
Worksheet
Weather Log
Rain or shine, get ready for some weather watching! Record data to observe the weather patterns over the course of a week.
1st Grade
Math
Worksheet
Basic Pictographs
Worksheet
Basic Pictographs
Practice adding multiple digits with a fun pictograph page. Use the chart to draw out the number of items in each problem.
1st Grade
Math
Worksheet
Make a Family Fridge Graph
Activity
Make a Family Fridge Graph
Make a fun refrigerator graph with your first grader in order to help her develop those crucial graphing skills, while engaging with the whole family.
1st Grade
Math
Activity
Picture Graphs
Worksheet
Picture Graphs
Practice drawing data onto a pictograph with this counting and adding worksheet.
1st Grade
Math
Worksheet
Ice Cream Graph #16
Worksheet
Ice Cream Graph #16
Help them keep track of their sales by drawing in a pictograph, and then answer a few math questions.
1st Grade
Math
Worksheet
Ice Cream Graph #11
Worksheet
Ice Cream Graph #11
Help them keep track of their sales by filling in a pictograph, and then answer a few math questions.
1st Grade
Math
Worksheet
Ice Cream Graph #14
Worksheet
Ice Cream Graph #14
Help Sam, Kate and Becky keep track of how many ice cream cones they've sold, and draw this data into a pictograph.
1st Grade
Math
Worksheet
Addition Picture Graphs
Worksheet
Addition Picture Graphs
Fill in the pictograph to help you visualize the problem first.
1st Grade
Math
Worksheet
Ice Cream Graph #18
Worksheet
Ice Cream Graph #18
Your child will keep track of their sales by drawing the data into a pictograph.
1st Grade
Math
Worksheet
Ice Cream Graph #13
Worksheet
Ice Cream Graph #13
Your child will keep track of their sales by putting the data into a pictograph.
1st Grade
Math
Worksheet
Ice Cream Graph #19
Worksheet
Ice Cream Graph #19
Your child will complete a pictograph to help them.
1st Grade
Math
Worksheet