Activity
Graph Math
Graphs may be introduced in math class but can also easily show up in history and science. Increase your child's confidence in interpreting bar graphs and throw a little candy into the mix to sweeten the learning process.
What You Need:
- Multicolored candy, like Smarties
- Pencil
- Paper
- Markers
What You Do:
- Pull out several handfuls of candy.
- Have your child sort the candy into piles by color.
- Have them count how many pieces of candy are in each pile and write down the numbers.
- Instruct your child to create a bar graph. Along the bottom line, which is referred to as the x-axis, you will need a section for each color. Along the vertical line, called the y-axis, write in numbers at increments of 5 or 10 depending on the amount of candy you've decided to use.
- Have your child draw bars that show how many pieces of candy they have for each color.
- Encourage them to use the markers to color the bars to emphasize the colors they represent and to make the graph more visually stimulating.
- Your learner has just created a bar graph! In order to check their work, make sure that the height of the bar corresponds with the number of candy pieces in each pile.
Once you've verified that the graph is correct, you can celebrate with a bit of candy!
Related learning resources
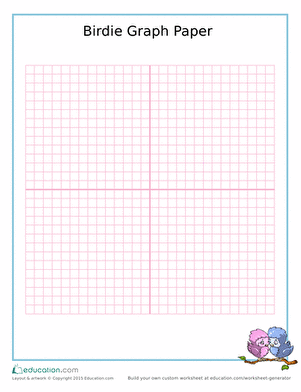
Birdie Graph Paper
Worksheet
Birdie Graph Paper
This blank graph paper is pretty in pink and features two adorable birds for a border.
5th Grade
Math
Worksheet
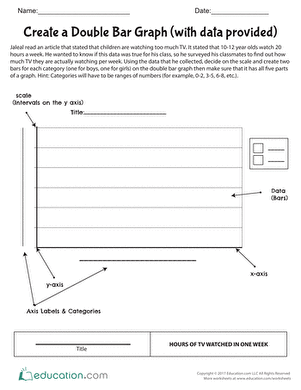
Create a Double Bar Graph (with data provided)
Worksheet
Create a Double Bar Graph (with data provided)
Ask your students to use data to create a double bar graph and interpret the graph with critical thinking.
5th Grade
Math
Worksheet

Create a Double Bar Graph (with your own data)
Worksheet
Create a Double Bar Graph (with your own data)
Students will collect data, create a double bar graph, and interpret the graph by responding to prompts that will get them thinking critically.
5th Grade
Math
Worksheet

Olympic Math: High Jump
Worksheet
Olympic Math: High Jump
Jump over the hurdles of math by learning mode, median and mean. Use knowledge of data analysis to put each country's scores in a graph and award the winners!
5th Grade
Math
Worksheet

Mystery Picture Graph: All Hallow's Eve
Worksheet
Mystery Picture Graph: All Hallow's Eve
Can you graph these coordinates to reveal the hidden picture?
5th Grade
Math
Worksheet
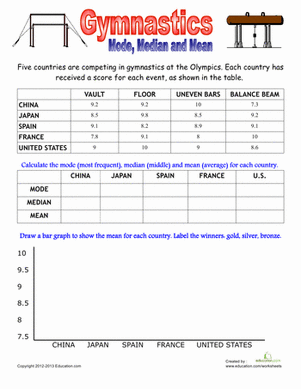
Olympic Math: Gymnastics
Worksheet
Olympic Math: Gymnastics
Practice basic data analysis, and then put the information in a bar graph.
5th Grade
Math
Worksheet
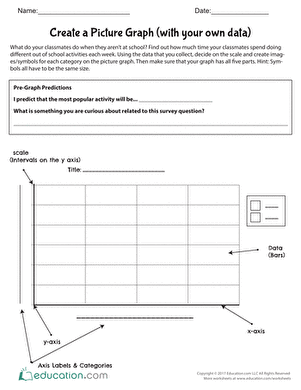
Create a Picture Graph (with your own data)
Worksheet
Create a Picture Graph (with your own data)
Using data that your students will generate in their class, they will create a picture graph that reflects how much time they spend doing different activities each week.
5th Grade
Math
Worksheet
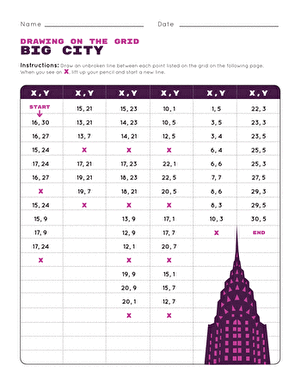
Mystery Picture Graph: Big City
Worksheet
Mystery Picture Graph: Big City
Math students will love plotting points on this coordinate grid as they see a mystery picture emerge.
5th Grade
Math
Worksheet

Solve a Graph Puzzle
Activity
Solve a Graph Puzzle
...fifth grade, math, science, graphing, coordinate...
5th Grade
Math
Activity

Interpreting Bar Chart Graphs
Worksheet
Interpreting Bar Chart Graphs
Learners practice using a bar graph to answer questions in this data and graphing worksheet.
5th Grade
Math
Worksheet

0.5 Centimeter Graph Paper
Worksheet
0.5 Centimeter Graph Paper
...Provide a helpful math and geometry resource! Use this worksheet for shapes, multiplication, or graphing coordinates....
4th Grade
Math
Worksheet

Mystery Picture Graph: Night Scene
Worksheet
Mystery Picture Graph: Night Scene
...This mysterious math sheet is full of fun for your geometry student! He'll plot these points on a coordinate grid to reveal a picture....
5th Grade
Math
Worksheet


